The Pharmacist
The Pharmacist (Pharmacist) is an open-access, peer-reviewed pharmacy journal, published half-yearly, as print and online by the The Pharmacist (Pharmacist) since 2025. With the aim of faster and better dissemination of knowledge, we will be publishing articles ‘Ahead of Print’ immediately upon acceptance of manuscript. In addition, the journal allows free access (Open Access) to its contents, which is likely to attract more readers and citations to articles published in journal. Manuscripts should be prepared in accordance with the author guidelines of the journal, w...
A rapid, cost-effective UV spectrophotometric method for quantifying ivabradine hydrochloride in simulated salivary fluid: Application to bilosomal nano-carrier characterization

Abstract
Background: To overcome the low oral bioavailability associated with conventional Ivabradine hydrochloride (IVA) therapies, nanotechnology based carriers are investigating. In this study for the delivery of IVA through buccal route bile salt based vesicular system bilosomes and buccoadhesive sponge was focused.
Materials and Methods: To estimate IVA in this buccal formulation, a simple, rapid, and cost-effective UV-Visible spectrophotometric method was developed and validated in phosphate-buffered simulated salivary fluid (SSF, pH 6.8) to establish a biorelevant assay tool. Method validation was done under International ICH Q2 (R2) guidelines confirmed an excellent linear relationship over a concentration range of 10–70 μg/mL at 286 nm (R2 = 0.998). The protocol proved highly robust and reproducible, maintaining standard deviations well within the acceptable regulatory threshold (% RSD < 2).
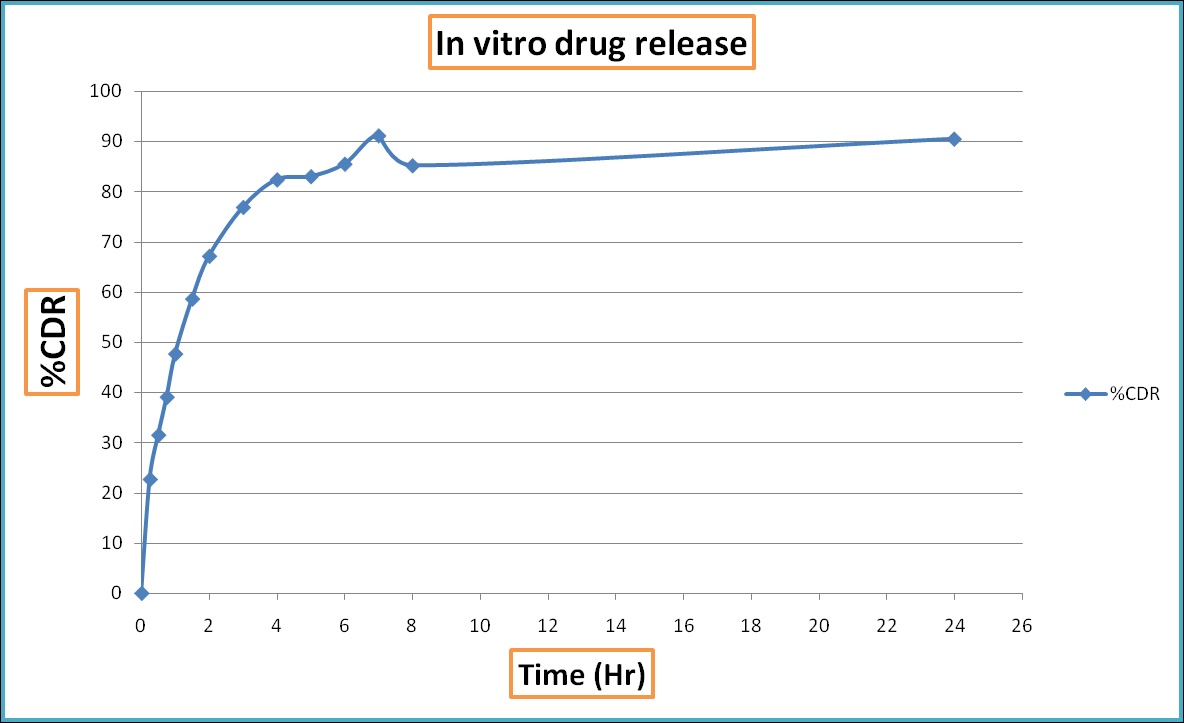
Results: Practical deployment of this validated method for formulation characterization revealed a mean drug entrapment efficiency of 82 %, within the nanovesicles and a uniform drug distribution of 96% throughout the porous sponge scaffold. In vitro drug release demonstrated a distinct biphasic kinetic profile, characterized by a 50% initial release in the initial hours followed by a gradual, controlled release phase sustained over 24 hours.
Conclusion: Collectively, these results confirm that the established spectrophotometric technique provides an accurate, high-throughput alternative to complex chromatographic assays for routine quality control, while the optimized bilosomal buccal nanosponge represents a promising therapeutic system for prolonged anti-anginal management.
1. Introduction
In recent years, Vesicular Drug Delivery Systems (VDDS) — such as liposomes, niosomes, and transferosomes — have gained significant attention due to their ability to improve drug solubility, prolong circulation time, and target specific tissues.[1] However, the structural complexity of these nano-carriers introduces unique analytical challenges. Because the Active Pharmaceutical Ingredient (API) coexists within a biphasic matrix—entrapped inside the aqueous core, or within the lipid bilayer, or remaining free in the external media — conventional bulk assay methods are inadequate. Therefore, developing specialized analytical methods is crucial.
The foundation of reliable pharmaceutical and chemical analysis relies on robust analytical method development and validation. Method development is the initial phase where a laboratory procedure is carefully selected and optimized to evaluate a substance's identity, purity, and potency. Following this, method validation serves as the critical verification step, confirming that the developed protocol is scientifically sound, reproducible, and fully compliant with stringent international regulatory frameworks, most notably the ICH Q2(R2) guidelines.[2]
This study focuses on the development of UV spectrophotometric method for the estimation of Ivabradine hydrochloride (IVA) in simulated biological fluid. IVA designated chemically as a benzazepinone derivative. By suppressing If current, IVA reduces the frequency of action potential initiation, thereby lowering the heart rate without compromising myocardial contractility.[3]
Despite being widely utilized in the management of coronary artery disease, IVA suffers from limited oral bioavailability.[4] To overcome this, an IVA-loaded bilosomal buccal sponge was engineered and studied, utilizing a bile salt-incorporated vesicular system incorporated in polymer blend. Following development, comprehensive characterization of the nanovesicular bilosomes and the porous sponge matrix was required, necessitating the validation of methods to determine drug content and in vitro release profiles in simulated physiological pH.
Various analytical methods like UV[5][6][7], HPLC[8][9][10][11][12][13][14],UPLC[15][16], HPTLC[17], LCMS[18] have been reported for the estimation of IVA in bulk and conventional tablet dosage forms. However, techniques other than UV-Visible spectrophotometry are often expensive, require sophisticated instrumentation, involve complex sample processing, and are time-consuming when applied to drug release quantification from nano formulations at physiological pH.
For routine preformulation studies, formulation analysis, and academic or industrial quality control, UV-Visible spectroscopy remains the most preferred approach due to its cost-effectiveness, rapidity, and operational simplicity.[19]
While previously reported UV spectroscopic methods for IVA were predominantly developed in a methanol solvent system for bulk drug and tablet assay, to the best of our knowledge, no UV method has been documented for estimating the in vitro and ex vivo release of IVA from nanocarrier-based delivery systems in a simulated biological pH medium.
Therefore, developing a method capable of accurately and precisely estimating drug release under conditions that closely mimic the human physiological environment, specially buccal region is highly necessary. To achieve this, simulated salivary fluid (SSF, pH 6.8) was selected as the dissolution medium, as it effectively simulates the microenvironment of the oral cavity while maintaining sink conditions. Because no spectrophotometric methods are currently available for quantifying release samples in this specific medium, this study aimed to develop and validate a simple, rapid, accurate, and reliable UV-Visible spectroscopic method for Ivabradine hydrochloride (IVA) in phosphate-based SSF (pH 6.8). Method validation was rigorously conducted in compliance with the International Conference on Harmonisation (ICH) Q2(R2) guidelines.[20] Furthermore, the newly developed method was successfully applied to characterize the engineered bilosomal buccal sponge, specifically for evaluating entrapment efficiency, drug content uniformity, and in vitro drug release profiles.
2. Materials and Methods
2.1. Materials
A Double beam UV-Visible Spectrophotometer (Shimadzu, model 1800) having two matched quartz cells with 1 cm path length and UV-Probe 2.35 software was used for all absorbance measurements. IVA was received as gift sample from the Zydus life sciences, Vadodara, Gujarat, India. Potassium Dihydrogen Phosphate and Sodium chloride (HPLC grade) were purchased from the Central Drug House (P) Ltd., New Delhi, India. Calcium chloride (Extrapure) was purchased from the Sisco research laboratories Pvt. Ltd., Mumbai, India. Distilled water from the Alga purifier system was used for entire study.
2.2. Methods
2.2.1. Preparation of simulated Salivary Fluid (pH-6.8) (SSF-pH-6.8)
Simulated salivary fluid (pH 6.8) was prepared by dissolving 12 mM potassium dihydrogen phosphate, 40 mM sodium chloride, and 1.5 mM calcium chloride in distilled water. The solution's pH was subsequently adjusted to 6.8 using sodium hydroxide.[21]
2.2.2. Selection of wavelength
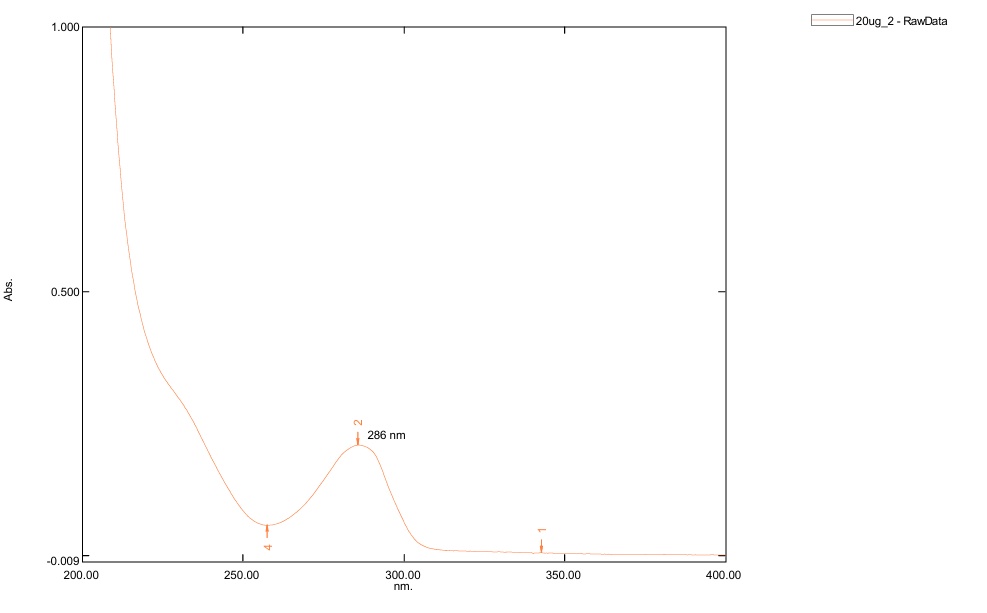
A standard stock solution of IVA 1000 μg/mL solution was prepared in SSF (pH 6.8). From standard stock solution, working standard solution of the 20 μg/mL was prepared. The wavelength was selected using this working standard solution. A full scan in the range of 200–400 nm was performed against a solvent blank. The wavelength of maximum absorbance (λmax) was identified as the highest peak in the absorbance spectrum, and this wavelength was chosen to ensure maximum sensitivity and minimal measurement error.
2.2.3. Analytical method validation
The analytical method was validated according to ICH protocols for specificity, linearity, accuracy, precision, robustness, LOD, and LOQ. A Shimadzu UV-1800 UV-Visible spectrophotometer with a 1 nm spectral bandwidth was employed for all operational and validation measurements.
2.2.4. Linearity and range
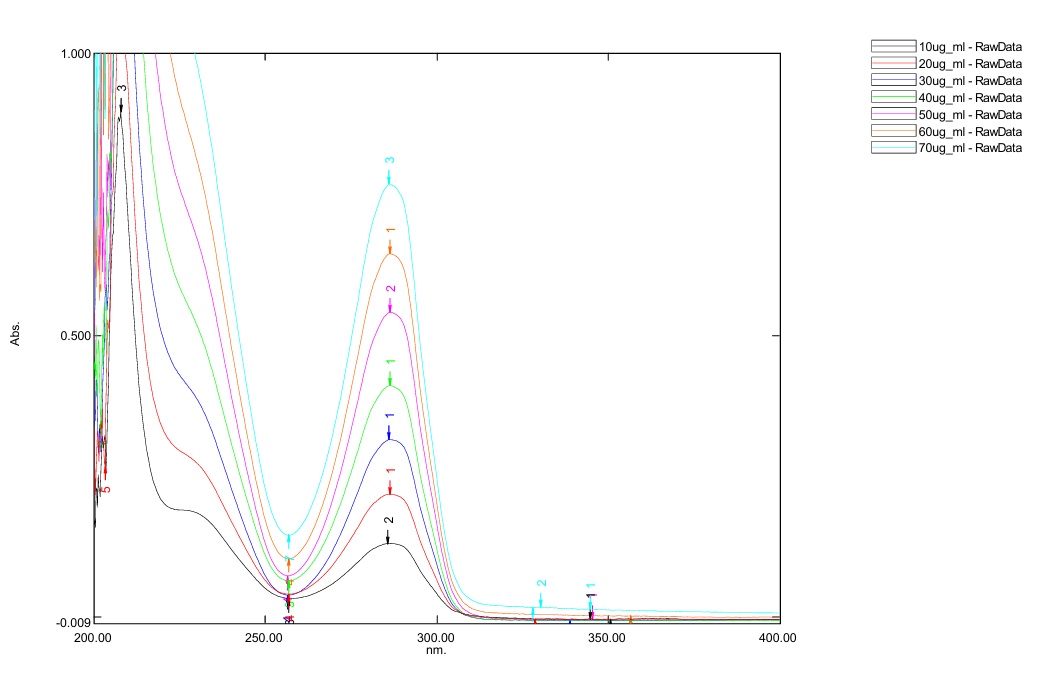
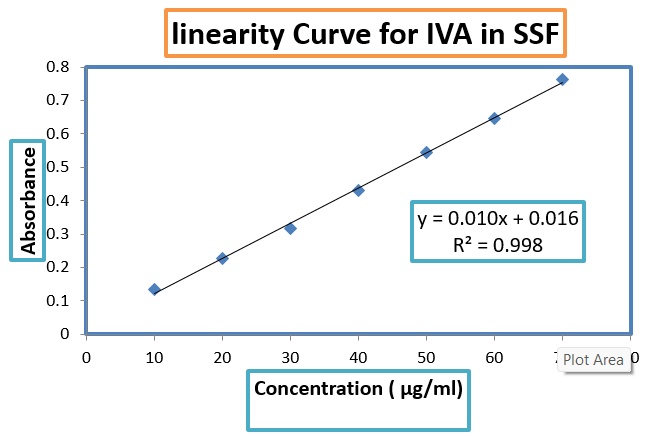
From the standard stock solution of IVA (1000 μg/ml), 10 ml was transferred into a 100 ml volumetric flask and the volume was adjusted to the mark to obtain a 100 μg/ml solution. From this solution, aliquots of 1, 2, 3, 4, 5, 6 and 7 ml were each transferred into separate 10 ml volumetric flasks, and the volumes were made up to the mark to prepare solutions of 10, 20, 30, 40, 50, 60 and 70 μg/ml, respectively, and each concentration (n = 5) was scanned at 286 nm against a SSF (pH – 6.8) blank to record the absorbance. A calibration plot of absorbance versus concentration was constructed, and linear regression analysis was performed to determine the slope, intercept, and correlation coefficient (r²). Linearity across the 10–70 µg/ml range was evaluated based on the regression parameters, and the results were considered acceptable when a linear relationship was observed.
2.2.5. Limit of Detection (LOD) and Limit of Quantitation (LOQ)
The LOD and LOQ of the drug were derived by calculating signal-to-noise ratio i.e. 3.3 (LOD) and 10 (LOQ) using the following equations as per ICH guidelines:
LOD = 3.3 × (σ/S)
LOQ = 10 × (σ/S)
Where,
σ= Standard deviation of the response (Y- intercepts of the 5 calibration curves).
S = Mean slope of the 5 calibration curves
2.2.6. Precision
The method's precision was assessed through studies of repeatability and intermediate precision.
2.2.7. Repeatability
The repeatability of the method was determined by performing six replicate measurements of a 30 μg/mL Ivabradine solution (IVA) under identical method conditions. The percent relative standard deviation (%RSD) was subsequently calculated from the collected responses.
2.2.8. Intermediate precision
Intraday and interday precision for the UV-Spectrophotometric method were determined by analyzing three different concentrations of the standard IVA solution (20, 30, and 40 μg/mL). The measurements were taken in triplicate on the same day (intraday) and repeated over three separate days within one week (Interday).
2.2.9. Accuracy
The accuracy was assessed by standard addition technique. Where, a known amount of standard stock solution was added to the 80%, 100%, and 120% of the pre-analyzed solution (20 µg/mL) of IVA. The samples were prepared in triplicate and the recovery percentage was determined as the percentage of the drug recovered from the sample and expressed as a relative percentage (%).
2.2.10. Robustness
The robustness of the developed UV-Visible spectrophotometric method was evaluated by introducing small, deliberate variations in the operational parameters. To assess robustness against wavelength shifts, sample absorbance were measured at two wavelengths flanking the established analytical maximum (± 1 nm from λmax) from specifically at 285 nm and 287 nm, instead of the 286 nm. Furthermore, intermediate precision (ruggedness) was verified by having the analysis performed independently by two different analysts under identical environmental conditions.
2.2.11. Specificity
To ensure accurate drug quantification without interference from excipients, the specificity of the developed UV spectroscopic method was rigorously evaluated. This was achieved by comparing the UV profiles of placebo formulations — consisting of drug-free bilosomes and drug-free buccal sponges — against a standard drug solution. The placebo matrices were subjected to the identical extraction protocol using simulated salivary fluid (SSF, pH 6.8). All three preparations were scanned across the UV range of 200 nm to 400 nm, and their absorbance values were recorded at the maximum wavelength (λmax) of 286 nm. Method specificity was confirmed as the placebo matrix components exhibited negligible UV absorbance at this selected analytical wavelength, demonstrating no spectral overlap with the active drug.
2.3. Application of the UV method for the characterization of bilosomes loaded buccal sponge
2.3.1. Entrapment efficiency
The prepared IVA loaded bilosomes was analyzed for entrapment efficiency. To determine the entrapped and unentrapped drug the prepared formulation was subjected to centrifugation.[22] The IVA content entrapped in bilosomes was extracted using methanol and the IVA content was estimated using the developed analytical method after filtering the sample through 0.22 mm filter. The trials were performed in triplicate. Drug concentration was calculated from the linearity curve further, entrapment efficiency was calculated using the following equation.

Where, Di – initial drug amount, Dn – un-entrapped drug
2.3.2. In-vitro drug release estimation from the prepared bilosomes
The method developed was evaluated to check its applicability for in-vitro drug release from IVA loaded bilosomes. The in vitro drug release study was conducted using the dialysis bag method.[23] To determine the release profile, samples were withdrawn at predetermined time points, followed by an immediate replacement of an equal volume of fresh SSF to preserve sink conditions. Concentration of the IVA in the samples was quantified spectrophotometrically at 286 nm, after extraction and filtration and the results were reported as the cumulative percentage of drug released.
2.3.3. Drug content determination in the prepared bilosomes loaded buccal sponge
The amount of IVA in the sponge was extracted with 10 ml of simulated saliva fluid (SSF; pH 6.8) at room temperature. After 5 h time the concentration of IVA was determined spectrophotometrically at 286 nm and compared to a preconstructed calibration curve. The % drug content was determined using the below formula.
3. Result and Discussion
3.1. Selection of wavelength
To determine the wavelength of maximum absorbance (λmax), a standard solution of IVA (20 μg/mL) prepared in simulated salivary fluid (SSF) was scanned across the ultraviolet spectrum ranging from 200 nm to 400 nm. The resulting absorption spectrum, illustrated in [Figure 1], displayed a distinct, characteristic absorption peak at 286 nm. Consequently, 286 nm was established as the λmax and selected for all subsequent quantitative spectrophotometric evaluations.
3.2. Analytical method validation
3.2.1. Linearity and range
The linearity of the UV-spectrophotometric assay for IVA was evaluated across a concentration range of 10 μg/mL to 70 μg/mL. As shown in [Figure 2], [Figure 3], the drug demonstrated an excellent correlation coefficient (R2= 0.998) within this concentration range, confirming a highly reliable linear relationship.
3.2.2. Limit of Detection (LOD) and Limit of Quantitation (LOQ)
The Limit of Detection (LOD) and Limit of Quantitation (LOQ) were derived from the linearity data; the resulting values are detailed in Table 1.
σ= Standard deviation of the response (Y- intercepts of the 5 calibration curves).
S = Mean slope of the 5 calibration curves
3.2.3. Precision
System precision was assessed through repeatability studies, while method precision was evaluated via intra-day and inter-day analyses. The resulting data are summarized in Table 2.
3.2.4. Accuracy
The percentage of recovery of known amounts of added IVA from standard solutions is shown in Table 3. The IVA recoveries were found to range from 98.240 % to 100.9833%. The % RSD of less than 1.5% was obtained in all the cases indicating the accuracy of the developed methods.
3.2.5. Robustness
The analytical performance of the UV method was found to be insensitive to small, deliberate environmental and operational modifications. As summarized in [Table 4], changing the detection wavelength to 285 and 287 resulted in reproducible absorbance profiles with an overall % RSD of 0.584. Furthermore, changing the analyst yielded no statistically significant variations in the assay parameters % RSD = 0.821. These low statistical variances demonstrate the excellent ruggedness of the method, indicating that it can be safely transferred between different analysts and instruments without sacrificing accuracy.
3.2.6. Specificity
The UV spectroscopic method demonstrated excellent specificity for the determination of the drug in the vesicular buccal formulations. When scanned between 200 nm and 400 nm in simulated salivary fluid (SSF, pH 6.8), the standard drug solution displayed a characteristic absorption peak at 286 nm. Under identical extraction conditions, the placebo formulations (blank bilosomes and drug-free buccal sponges) showed no observable peaks and exhibited baseline-level absorbance at 286 nm. This lack of spectral interference from the structural lipids, surfactants, and sponge matrix confirms that the developed method is highly selective for the active pharmaceutical ingredient.
|
Parameter |
Formula |
Result |
|---|---|---|
|
Limit of detection |
LOD = 3.3 × (σ/S) |
0.09 μg /mL |
|
Limit of quantification |
LOQ = 10 × (σ/S) |
0.28 μg /mL |
|
Concentration ( μg /mL) |
Intraday precision |
Interday precision |
Repeatability |
||||||
|---|---|---|---|---|---|---|---|---|---|
|
Absorbance measured (mean) |
SD |
RSD (%) |
Absorbance measured (mean) |
SD |
RSD (%) |
Absorbance measured (mean) |
SD |
RSD (%) |
|
|
30 |
0.332 |
0.006 |
1.89 |
0.330 |
0.0041 |
1.2 |
0.326 |
0.0033 |
1.01 |
|
40 |
0.419 |
0.007 |
1.78 |
0.436 |
0.0052 |
1.19 |
|||
|
50 |
0.542 |
0.007 |
1.29 |
0.542 |
0.0060 |
1.11 |
|||
|
Conc. of sample taken |
Amount added (%) |
Recovery (%) |
SD |
RSD (%) |
|---|---|---|---|---|
|
20 μg /mL |
80 |
98.240 |
0.2047 |
0.208 |
|
100 |
100.833 |
0.9638 |
0.955 |
|
|
120 |
100.045 |
1.0357 |
1.035 |
|
Robustness by different analyst |
||||||
|---|---|---|---|---|---|---|
|
Concentration of sample |
Absorbance by Analyst 1 |
Absobance by Analyst 2 |
- |
mean |
SD |
RSD (%) |
|
40 |
0.433 |
0.428 |
- |
0.430 |
0.0035 |
0.8212 |
|
Robustness by change in wavelength |
||||||
|
Conc. of sample |
Absorbance at 285 nm |
Absorbance at 286 nm |
Absorbance at 287 nm |
mean |
SD |
RSD (%) |
|
40 |
0.428 |
0.433 |
0.431 |
0.430 |
0.0025 |
0.584 |
3.3. Application of the UV method for the characterization of bilosomes loaded buccal sponge
3.3.1. Entrapment efficiency and drug loading
The validated UV-Visible spectrophotometric method was successfully applied to determine the entrapment efficiency (% EE) of IVA within the engineered nanovesicular bilosomes prior to their incorporation into the sponge matrix. The concentration of the unentrapped drug was derived directly from the established regression equation. The entrapment efficiency of the optimized formulation was found to be 82.71%. The low percentage relative standard deviation (% RSD of 1.36%) demonstrated high reproducibility, confirming that the developed method is highly efficient and reliable for quantifying drug encapsulation in IVA-based nanocarriers.
3.3.2. In vitro drug release
To evaluate the dissolution profile, aliquots were withdrawn at predetermined intervals and immediately replaced with an equal volume of fresh, pre-warmed SSF to maintain sink conditions. The collected samples were filtered and analyzed directly using the established calibration curve equation. The formulation exhibited a classic biphasic release pattern, characterized by an initial burst release of approximately 50% of the cumulative drug amount within the first hour, followed by a sustained and controlled release phase extending up to 24 hours ([Figure 4]).
3.3.3. Drug content determination in the prepared bilosomes loaded buccal sponge
The practical performance of the developed UV method was evaluated by quantifying the total drug content within the fabricated bilosomal buccal sponges following a 5-hour extraction period in simulated salivary fluid (SSF, pH 6.8). The filtered samples were analyzed at 286 nm and concentrations were calculated using the standard regression equation. The optimized buccal sponge formulation exhibited an exceptional mean drug content of 96 %. These findings verify that the developed spectrophotometric technique is highly dependable method for routine content uniformity assays.
4. Conclusion
The analytical method developed on UV spectrophotometer to determine the concentration of IVA in SSF (pH-6.8) was validated in terms of the linearity of the linear regression equation, accuracy, interday precision and intraday precision, repeatability of method, specificity and robustness. This method was reliable having RSDs <2%. Further the developed method will be useful in estimating the encapsulation efficiency of the IVA in the lipid- based formulations and to determine the percent drug release from the lipid-based formulations. For these applications, the developed methods were found to be accurate, simple and reliable.
5. Acknowledgment
Authors would like to thank Zydus life sciences, Vadodara, Gujarat for providing drug as a gift sample. The authors used AI to improve the clarity of language and grammatical structure of the manuscript
6. Authors Contribution
[Vrundakumari R. Solanki]: Conceptualization, methodology, experimental execution, formal analysis, data curation, writing – original draft preparation, and visualisation.
[Vijaykumar K. Parmar]: Conceptualization, supervision, resources, project administration, review & editing. All authors have read and agreed to the published version of the manuscript.
7. Source of Funding
None.
8. Conflict of Interest
None.
References
- Jain S, Jain V, Mahajan SC. Lipid Based Vesicular Drug Delivery Systems. Adv Pharm. 2014. [Google Scholar] [Crossref]
- Mayuri D, Ravindranath S. Analytical Method Development and Validation : A Review. J Drug Deliv Ther. 2019;9:563-70. [Google Scholar]
- Simko F, Baka T. Ivabradine and Blood Pressure Reduction: Underlying Pleiotropic Mechanisms and Clinical Implications. Front Cardiovasc Med. 2021;8:607998. [Google Scholar] [Crossref]
- Balata GF, Faisal MM, Elghamry HA, Sabry SA. Preparation and Characterization of Ivabradine HCl Transfersomes for Enhanced Transdermal Delivery. J Drug Deliv Sci Technol. 2020;60:101921. [Google Scholar] [Crossref]
- Krutika P, Patel A. Development and validation of Two UV Spectrophotometric methods for simultaneous estimation of Carvedilol and Ivabradine hydrochloride in synthetic mixture. Int J All Res Educ Sci Methods. 2021. [Google Scholar]
- Thete PG, Saudagar RB. Quantitative determination and validation of novel derivative spectrophotometric method for estimation of Ivabradine hydrochloride in bulk and marketed formulation. Asian J Pharm Pharmacol. 2018;4(5):697-701. [Google Scholar] [Crossref]
- Mostafa N, Fayez Y, Farid J, Abd EAAA. Stability Indicating Spectrophotometric Methods for Determination of Ivabradine Hydrochloride in the Presence of Its Degradation Product. Anal Chem Lett. 2017;7(3):280-94. [Google Scholar] [Crossref]
- Kanthale SB, Thonte SS, Mahapatra DK. Stability indicating RP-HPLC method for the simultaneous estimation of ivabradine and metoprolol in bulk and tablet formulation. J Appl Pharm Sci. 2019;9(4):137-44. [Google Scholar] [Crossref]
- Pikul P, Nowakowska J, Ciura K. Effect of non-aqueous and buffered mobile-phase composition on the retention of ivabradine. J Liq Chromatogr Relat Technol. 2014;37(13):1837-46. [Google Scholar] [Crossref]
- Rajakumari S, Rajitha G, Susmita AG. Developement and Validation of Stability Indicating Rp-Hplc Method for the Estimation of Metoprolol and Ivabradine in Solid Dosage Form. World J Pharm Res. 2019;11(6):2786-92. [Google Scholar] [Crossref]
- Rehman1 MM, Nagamallika G. Validated RP-HPLC Method for the Determination of Ivabradine Hydrochloride in Pharmaceutical Formulation. Int J Pharm Sci Drug Res. 2017;9:228-33. [Google Scholar] [Crossref]
- Tomić J DN, Agbaba D OBMAPA. Robust optimization of gradient RP HPLC method for simultaneous determination of ivabradine and its eleven related substances by AQbD approach. Acta Chromatogr. 2021;34(1):1-11. [Google Scholar] [Crossref]
- Tomić J IBOSNK, Maljuric N, Dani AP. Chemometrically Assisted RP-HPLC Method Development for Efficient Separation of Ivabradine and its Eleven Impurities. Acta Chromatogr. 2020;32(1):53-63. [Google Scholar] [Crossref]
- Maheshwari S, Khandhar A, Jain A. Quantitative Determination and Validation of Ivabradine HCL by Stability Indicating RP-HPLC Method and Spectrophotometric Method in Solid Dosage Form. Eurasian J Anal Chem. 2010. [Google Scholar] http://www.eurasianjournals.com/Quantitative-Determination-and-Validation-of-Ivabradine-HCL-by-Stability-Indicating,78338,0,2.html
- Gandi S, Manikandan A, Rao SV. Novel stability indicating rp-uplc method for simultaneous determination of ivabradine and metoprolol drug materials in bulk and their pharmaceutical dosage forms. Res J Pharm Technol. 2020;13(1):250-4. [Google Scholar] [Crossref]
- Zoerner AA, Schroeder C, Kayacelebi AA, Suchy MT, Gutzki FM, Stichtenoth DO. A validated, rapid UPLC-MS/MS method for simultaneous ivabradine, reboxetine, and metoprolol analysis in human plasma and its application to clinical trial samples. J Chromatogr B Analyt Technol Biomed Life Sci. 2013;927:105-11. [Google Scholar] [Crossref]
- Motisariya MH, Patel KG, Shah PA. Validated stability-indicating high performance thin layer chromatographic method for determination of Ivabradine hydrochloride in bulk and marketed formulation: An application to kinetic study. Bull Fac Pharmacy, Cairo Univ. 2013;51(2):233-41. [Google Scholar] [Crossref]
- Patel PN, Borkar RM, Kalariya PD, Gangwal RP, Sangamwar AT, Samanthula G. Characterization of degradation products of Ivabradine by LC-HR-MS/MS: A typical case of exhibition of different degradation behaviour in HCl and H2SO4 acid hydrolysis. J Mass Spectrom. 2015;50(2):344-53. [Google Scholar] [Crossref]
- Rapalli VK, Kaul V, Gorantla S, Waghule T, Dubey SK, Pandey MM. UV Spectrophotometric method for characterization of curcumin loaded nanostructured lipid nanocarriers in simulated conditions: Method development, in-vitro and ex-vivo applications in topical delivery. Spectrochim Acta A Mol Biomol Spectrosc. 2020;224:117392. [Google Scholar] [Crossref]
- ICH HG. ICH Q2(R2) guidelines Validation of analytical proceduresQ2(R2). Int council for harmonization. 2023. [Google Scholar] https://database.ich.org/sites/default/files/ICH_Q2(R2)_Guideline_2023_1130.pdf
- Nair AB, Shah J, Jacob S, Al-Dhubiab BE, Patel V, Sreeharsha N. Development of Mucoadhesive Buccal Film for Rizatriptan: In Vitro and In Vivo Evaluation. Pharmaceutics. 2021;13(5):728. [Google Scholar] [Crossref]
- Lv Y, He H, Qi J, Lu Y, Zhao W, Dong X. Visual validation of the measurement of entrapment efficiency of drug nanocarriers. Int J Pharm. 2018;547(1-2):395-403. [Google Scholar] [Crossref]
- D’Souza S. A Review of In Vitro Drug Release Test Methods for Nano-Sized Dosage Forms. Adv Pharm. 2014;2014:1-12. [Google Scholar] [Crossref]
- Abstract
- 1. Introduction
- 2. Materials and Methods
- 2.1. Materials
- 2.2. Methods
- 2.2.1. Preparation of simulated Salivary Fluid (pH-6.8) (SSF-pH-6.8)
- 2.2.2. Selection of wavelength
- 2.2.3. Analytical method validation
- 2.2.4. Linearity and range
- 2.2.5. Limit of Detection (LOD) and Limit of Quantitation (LOQ)
- 2.2.6. Precision
- 2.2.7. Repeatability
- 2.2.8. Intermediate precision
- 2.2.9. Accuracy
- 2.2.10. Robustness
- 2.2.11. Specificity
- 2.3. Application of the UV method for the characterization of bilosomes loaded buccal sponge
- 3. Result and Discussion
- 3.1. Selection of wavelength
- 3.2. Analytical method validation
- 3.2.1. Linearity and range
- 3.2.2. Limit of Detection (LOD) and Limit of Quantitation (LOQ)
- 3.2.3. Precision
- 3.2.4. Accuracy
- 3.2.5. Robustness
- 3.2.6. Specificity
- 3.3. Application of the UV method for the characterization of bilosomes loaded buccal sponge
- 4. Conclusion
- 5. Acknowledgment
- 6. Authors Contribution
- 7. Source of Funding
- 8. Conflict of Interest
- References
Article Metrics
- Visibility 463 Views
- Downloads 339 Views
- DOI 10.18231/j.pharmacist.17789.1782462167
-
CrossMark

- Citation
- Received Date May 12, 2026
- Accepted Date June 17, 2026
- Publication Date July 07, 2026